Unemployment levels in certain regions provide valuable insights that help recruitment businesses make informed decisions about supply of labor, competition they may be facing, broader economic trends and strategic planning.
So far in 2024, the US recorded unemployment rates of 3.7% in January and 3.9% in February, while job creation has been exceeding expectations.
Earlier this month the US Bureau of Labor Statistics released its annual regional and state unemployment summary for 2023. Here is what the data showed.
Regional Unemployment
In 2023, the West emerged as the only census region to experience a change in its annual average unemployment rate compared to 2022, with a slight increase of 0.2 percentage points. Meanwhile, the Midwest and South showcased jobless rates lower than the national average, at 3.4 percent and 3.3 percent, respectively. The West, however, recorded a higher rate of 4.2 percent.
Among census divisions, the West North Central boasted the lowest jobless rate at 2.8 percent, while the Pacific and Middle Atlantic divisions reported the highest rates at 4.5 percent and 4.0 percent, respectively. Notably, the East South Central and South Atlantic divisions set new series lows with rates of 3.3 percent and 3.0 percent, respectively.
State Unemployment
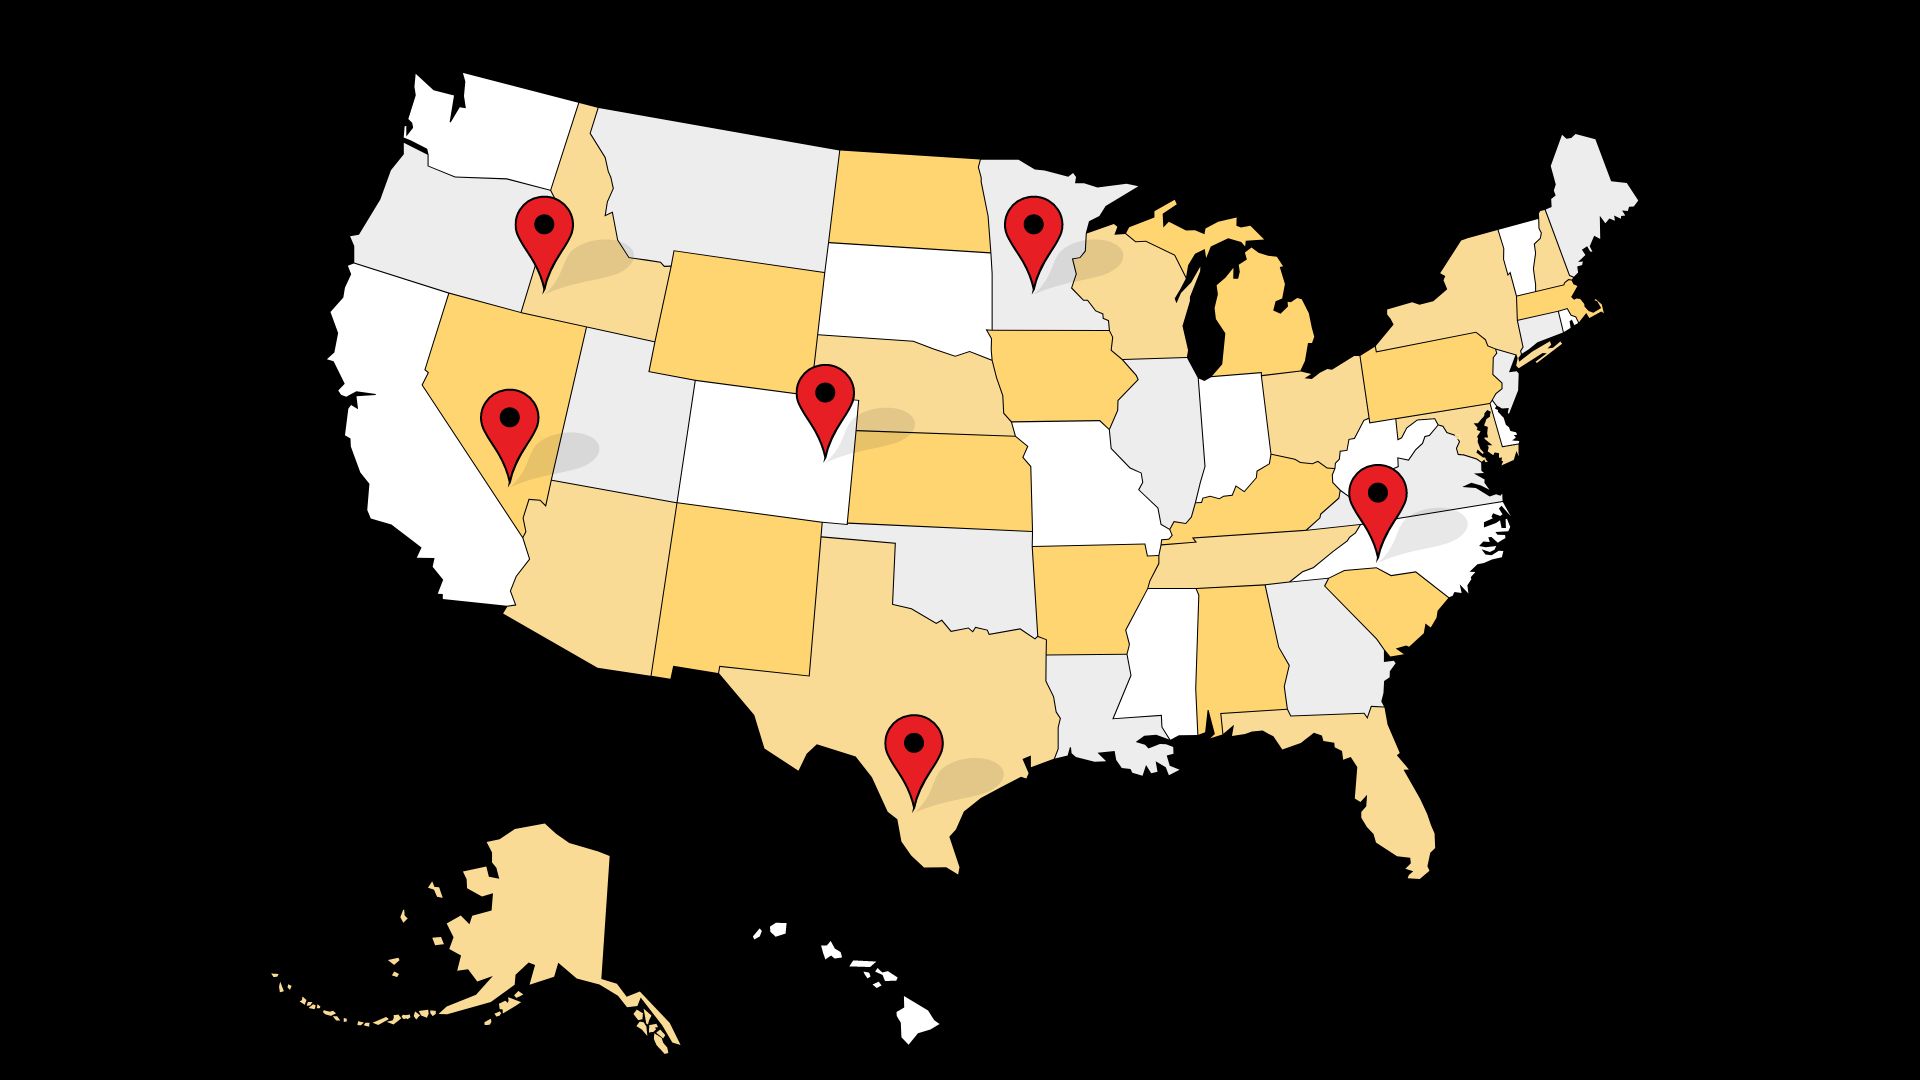
North Dakota emerged as the state with the lowest jobless rate in 2023, standing at an impressive 1.9 percent. On the other end of the spectrum, Nevada reported the highest unemployment rate at 5.1 percent. Six states achieved new annual average series lows, including Maryland, Mississippi, North Dakota, Ohio, Pennsylvania, and Vermont.
States with statistically significant unemployment rate changes, 2022-23 annual averages.
| State | 2022 rate | 2023 rate | Over-the-year rate change |
| California | 4.3 | 4.8 | 0.5 |
| Maryland | 3.0 | 2.1 | -.9 |
| Mississippi | 3.8 | 3.2 | -.6 |
| New Jersey | 3.9 | 4.4 | .5 |
| Ohio | 4.0 | 3.5 | -.5 |
| Pennsylvania | 4.1 | 3.4 | -.7 |
| Vermont | 2.3 | 2.0 | -.3 |
| Wyoming | 3.4 | 2.9 | -.5 |
Regional Employment-Population Ratios
The Northeast, Midwest, and South witnessed increases in their employment-population ratios in 2023, indicating a growing proportion of the civilian noninstitutional population aged 16 and over who are employed. The Midwest led with the highest ratio at 62.1 percent, while the South recorded the lowest ratio at 59.3 percent.
State Employment-Population Ratios
Michigan experienced the largest increase in its employment-population ratio in 2023, followed by Vermont and Virginia. Notably, the District of Columbia boasted the highest proportion of employed individuals at 68.2 percent, setting a new high in its annual average series. Conversely, Mississippi and West Virginia reported the lowest ratios among the states.
States with statistically significant employment-population ratio changes, 2022-23 annual averages.
| State | 2022 ratio | 2023 ratio | Over-the-year ratio change |
| Florida | 57.3 | 57.9 | 0.6 |
| Maryland | 62.8 | 63.7 | .9 |
| Michigan | 57.9 | 59.5 | 1.6 |
| Nevada | 58.4 | 59.5 | 1.1 |
| New Mexico | 54.2 | 55.1 | .9 |
| New York | 57.6 | 58.6 | 1.0 |
| Oklahoma | 59.9 | 60.9 | 1.0 |
| Vermont | 62.1 | 63.4 | 1.3 |
| Virginia | 63.2 | 64.5 | 1.3 |
Implications for recruitment businesses
States with low unemployment rates and high employment-population ratios signify a competitive job market with a potential scarcity of qualified candidates. On the other hand, states with significant increases in employment ratios present opportunities for expansion and talent acquisition. While the industry you recruit in also matters, along with other economic factors, keeping an eye on these rates can significantly help your recruitment business for the rest of 2024.
